Call center staffing calculator for final expense transfer floors: how many transfers your agents can take (Erlang B)
How many transfers a final expense floor can take an hour and a day before transfers are lost: an Erlang B calculator that solves both directions, a worked table, the monthly cost at published transfer prices and a 50-state table of residents 65 and older per agent job.
General information, not legal advice. This guide summarizes the rules in the sources listed at the end, as read on . Rules change, and they differ by state and by business, so check with a lawyer licensed where you call before relying on it.
On this page
- How many final expense transfers can a floor take per day before transfers are lost?
- Why does a live-transfer floor need a loss model (Erlang B) when queued inbound centers use Erlang C?
- How many agents does a target loss rate need at your handle time and transfers per hour?
- What does the worked table show at a 30-minute handle time?
- What does that daily volume cost per month at the published transfer price?
- What else caps daily volume: coverage hours, time zones and the states your agents are licensed in?
- How do you measure handle time, arrivals and lost transfers on your own floor?
- Which states have the most residents 65 and older per insurance sales agent?
- Questions
- Sources
Transfers offered an hour per agent at a 5% loss target
Erlang B loss model, 30-minute handle time, random arrivals (example inputs)
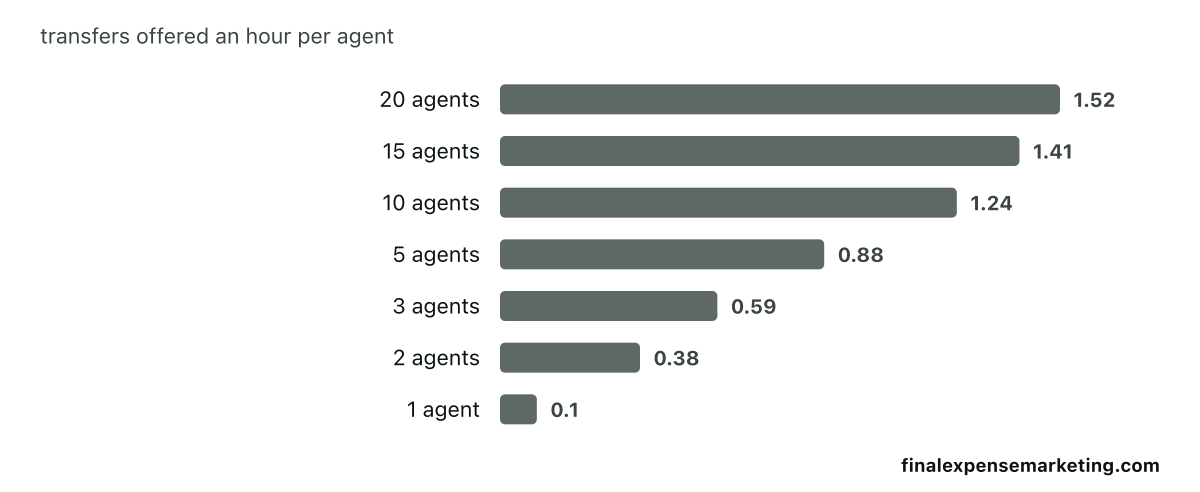
| Row | transfers offered an hour per agent |
|---|---|
| 20 agents | |
| 15 agents | |
| 10 agents | |
| 5 agents | |
| 3 agents | |
| 2 agents | |
| 1 agent |
Computed with Erlang’s B-formula (Iversen, Teletraffic Engineering and Network Planning, 2015, ch. 4). Example inputs, not benchmarks.
A call center staffing calculator for final expense transfers needs Erlang B, because a transfer no agent picks up within seconds is lost to your floor. With example inputs of 10 agents, a 30-minute handle time and a 5% loss target, a floor can be offered 12.4 transfers an hour and takes about 94 a day over 8 hours.
The Erlang B calculator above solves both directions of call center capacity planning for a transfer floor: the agents a loss target needs, and the transfers a given floor can be offered. It is built for call-floor managers, agency owners and licensed agents buying live transfers. We publish no handle-time, contact or close data, so every input here is an example, not a benchmark. Use the calculator with your own figures, or read the tables below as its worked examples. This is not legal advice.
How many final expense transfers can a floor take per day before transfers are lost?
A transfer floor's daily capacity is the number of transfers it takes in a day at your loss target, the share lost you accept. Find the most transfers the floor can be offered an hour at that target, take away the share lost, and multiply by your coverage hours, the hours transfers can arrive while your agents are on seat. A transfer that finds every agent busy is lost to your floor, whether the vendor re-routes it, books a callback or loses the prospect.
Take ten agents on seat, a 30-minute handle time (from connect until the agent is ready for the next transfer, after-call work included) and a 5% loss target, all example inputs. Under Erlang B they can be offered up to 12.4 transfers an hour, lose 4.95% of them and are busy 58.9% of the time, their occupancy. Across 8 coverage hours their daily capacity is about 94 transfers taken, from about 99 offered.
Size to the busiest hour. Arrivals bunch when delivery windows overlap, as the time-zone table below shows, so a daily average understates the peak. What a missed transfer costs depends on the vendor's terms. Our page on interest-verified transfers and when one is billable lists “You, or someone you authorise, are available to take it” among the five billing rules, and “You were unavailable after confirming availability” among the outcomes that are not refundable. Confirm only the hours someone can actually pick up.
Why does a live-transfer floor need a loss model (Erlang B) when queued inbound centers use Erlang C?
A live-transfer floor needs a loss model because a transfer cannot wait long for an agent. The consumer and the screener are on the line together, and if no agent is free within seconds, the transfer goes somewhere else or nowhere. Erlang B models that case; Erlang C models callers who wait.
What Erlang B assumes
Erlang's B-formula dates from 1917. Villy B. Iversen's Teletraffic Engineering and Network Planning (Technical University of Denmark, revised 2015) sets out what it assumes:
- Blocked calls are cleared. “A blocked (= rejected, lost) call attempt disappears without any after-effect as it may be accepted by an alternative route.” Iversen calls this “Erlang’s loss model or the Blocked Calls Cleared = BCC–model”.
- Arrivals are random. “The fundamental assumption for the validity of Erlang’s B-formula is the Poisson arrival process”, which here means transfers arrive independently of one another.
- Only the average handle time matters. The formula “is valid for arbitrary holding time distributions” (holding time is handle time), so only the mean enters it.
- Load is counted in erlangs. Offered load is transfers offered an hour times handle time in hours. In Iversen's example, “If the call intensity is 5 calls per minute, and the mean service time is 3 minutes then the offered traffic is equal to 15 erlang.” Sixteen transfers an hour at 30 minutes is 8 erlangs, and “a channel can at most carry one erlang”.
Where Erlang C still fits
Iversen describes Erlang’s delay system, the system behind Erlang C: “When all n servers are busy, an arriving customer joins the queue and waits until a server becomes idle.” It fits a service line where callers wait their turn, and staffing calculators built for those lines use it. Voxjar's Erlang C calculator assumes that “when every agent is busy, callers wait in a queue”, and Call Centre Tools adds the Erlang A formula, which assumes an “Average Patience” for callers who give up while waiting. In the delay system, Iversen notes, “the carried traffic will be equal to the offered traffic as no customers are blocked”, so an Erlang C calculator run on transfers counts every one as answered. Erlang A lets some callers give up, but it still lets every transfer wait.
Transfer vendors describe what happens instead. Lead Heroes says that if the agent cannot answer, “the telemarketer affirms that the agent will call back shortly, and the lead is delivered via email instantaneously”. Tele Leads Agency says some vendors keep a transfer waiting for sixty seconds, and warns that the prospect may hang up before an agent picks up (vendor claims, seen October 22, 2026; the Lead Heroes page is undated). Erlang B allows no wait at all, so on a line with a short wait the tables here are the cautious case. A transfer no agent picks up in time is gone from your floor, which is why transfers need someone free the moment a call connects.
How many agents does a target loss rate need at your handle time and transfers per hour?
The agents a target loss rate needs depend on the transfers offered an hour in your busiest hour and on your handle time. At a 30-minute handle time, 16 transfers an hour need 11 agents for a 10% loss target, 13 for 5% and 14 for 2%. Both tables below use that 30-minute example, and the paragraph after the second shows how a different handle time moves them.
Staffing a transfer floor for a target loss rate
Read across from the transfers offered an hour, or their offered load in erlangs, to the loss target you accept.
| Transfers offered an hour | Offered load (erlangs) | Agents for a 10% loss target | Agents for 5% | Agents for 2% |
|---|---|---|---|---|
| 4 | 2 | 4 | 5 | 6 |
| 8 | 4 | 7 | 8 | 9 |
| 12 | 6 | 9 | 10 | 12 |
| 16 | 8 | 11 | 13 | 14 |
| 20 | 10 | 13 | 15 | 17 |
Tightening the target weighs most on small floors. Moving from a 10% to a 2% loss target means 50% more agents at 4 transfers an hour (4 to 6), but 31% more at 20 an hour (13 to 17). These are agents on seat in the hour. Schedule more to cover breaks, meetings and absences across your coverage hours, using your own attendance records.
Transfers a given floor can be offered
For the agents you have on seat, this table gives the most transfers offered an hour that keep the share lost at or under each target, rounded down to 0.1. The last column divides the unrounded 5% figure by the agents.
| Agents on seat | Transfers offered an hour at a 10% loss target | At 5% | At 2% | Offered per agent at 5% |
|---|---|---|---|---|
| 1 | 0.2 | 0.1 | under 0.1 | 0.10 |
| 2 | 1.1 | 0.7 | 0.4 | 0.38 |
| 3 | 2.5 | 1.7 | 1.2 | 0.59 |
| 5 | 5.7 | 4.4 | 3.3 | 0.88 |
| 10 | 15.0 | 12.4 | 10.1 | 1.24 |
| 15 | 24.9 | 21.2 | 18.0 | 1.41 |
| 20 | 35.2 | 30.4 | 26.3 | 1.52 |
Handle time scales every figure, because the model works in erlangs. Ten agents at a 5% loss target can be offered 18.6 transfers an hour at a 20-minute handle time, 12.4 at 30 minutes and 8.2 at 45. At another handle time, read the first table at your offered load or the next higher one, or multiply a rate in the second table by 30 and divide by your handle time in minutes. The calculator above does both, and the measurement section below shows how to take your average.
Why small floors need paced delivery
Capacity per agent climbs with floor size. In Iversen's words, “for a given congestion E we obtain the highest utilization for large channel groups (economy of scale).” At a 5% loss target, one agent can be offered 0.10 transfers an hour, each of 5 agents 0.88 and each of 20 agents 1.52, because a larger pool is more likely to have someone free when a random transfer lands.
A solo agent offered one transfer an hour at a 30-minute handle time loses 33.3% of them, and keeping that agent to a 5% loss target allows about 0.1 transfers an hour of random arrivals, 0.8 a day across 8 coverage hours. Solo agents and two-agent agencies can take more than the random-arrival rates in the table at a 5% loss target only if delivery is paced to free agents. Tele Leads Agency advises buyers to “Communicate your daily cap and agent count to your vendor at campaign start so they throttle delivery automatically.” Lead Heroes takes the other route. It “can only initiate live transfers for agencies or teams that have at least 3 agents available to take calls”, and smaller teams and individual agents “will instead receive instant email notifications of leads generated” (vendor claims, seen October 22, 2026). Paced arrivals are no longer random, so the tables overstate loss on a paced line; the measurement section shows how to tell.
What does the worked table show at a 30-minute handle time?
The worked table shows the share lost rising faster than the load. Ten agents lose 1.8% of 10 transfers an hour, 12.2% of 16 and 16.8% of 18. In the table, offered load is transfers offered an hour times 0.5 hours, and Erlang B gives the share lost. Transfers taken an hour are those offered times one minus the share lost, and occupancy is the load the agents carry divided by the agents on seat.
| Agents on seat | Transfers offered an hour | Offered load (erlangs) | Share lost | Transfers taken an hour | Occupancy |
|---|---|---|---|---|---|
| 1 | 1 | 0.5 | 33.3% | 0.67 | 33% |
| 2 | 2 | 1 | 20.0% | 1.60 | 40% |
| 5 | 6 | 3 | 11.0% | 5.34 | 53% |
| 5 | 8 | 4 | 19.9% | 6.41 | 64% |
| 10 | 10 | 5 | 1.8% | 9.82 | 49% |
| 10 | 14 | 7 | 7.9% | 12.90 | 64% |
| 10 | 16 | 8 | 12.2% | 14.05 | 70% |
| 10 | 18 | 9 | 16.8% | 14.98 | 75% |
Reading the table:
- Loss climbs faster than load. Going from 16 to 18 transfers an hour on 10 agents offers 12.5% more transfers but raises the share lost from 12.2% to 16.8%; the floor takes only 0.9 more an hour.
- A loss system runs with idle agents. One agent offered one transfer an hour is busy 33% of the time yet loses 33.3% of them; ten agents offered 18 an hour are busy 75% of the time and still lose 16.8%. Five agents offered 8 an hour lose 19.9%, about one transfer in five. As Iversen notes, “At a blocking probability E = 1 % a single channel can at most be used 36 seconds per hour on the average!”
- Large floors are more sensitive to surges. “Large channel groups are more sensitive to a given percentage overload than small channel groups.” With 20% more transfers than planned, floors sized to a 5% loss target lose 6.7% (2 agents), 8.2% (5 agents), 9.8% (10 agents) and 11.6% (20 agents).
What does that daily volume cost per month at the published transfer price?
A floor that takes 80 transfers a day for 21 working days, 1,680 a month, spends $184,800 on them at our published interest-verified price, if every one is billable. Spend on transfers taken is transfers taken a day, times working days, times the price per billable transfer. In the table the 21 working days are an example input, and the agents beside each volume are sized for a 5% loss target with arrivals spread evenly over 8 coverage hours.
| Transfers taken a day | Agents on seat if arrivals are even across 8 hours (share lost) | Transfers a month | Interest-verified, $110 each | Pre-vetted Guaranteed Issue, $250 each | Pre-vetted Level/Graded, $300 each |
|---|---|---|---|---|---|
| 10 | 3 (2.5% lost) | 210 | $23,100 | $52,500 | $63,000 |
| 20 | 4 (3.4% lost) | 420 | $46,200 | $105,000 | $126,000 |
| 40 | 6 (3.4% lost) | 840 | $92,400 | $210,000 | $252,000 |
| 80 | 9 (4.6% lost) | 1,680 | $184,800 | $420,000 | $504,000 |
Agents are sized on transfers offered. To take 80 a day with a share lost of 5% or less, a floor has to be offered about 84.2 across 8 hours, which needs 9 agents (4.6% lost). One more agent cuts the share lost on those 84.2 offered to 2.4%. Uneven delivery needs more agents. If those 84.2 came from four time zones stacked as in the time-zone table below, the busiest hour would bring 21.1 transfers and need 15 agents.
The prices are per billable transfer, before any discount. The table prices transfers taken. A transfer that fails any of the five billing rules is not billed, but our terms list “You were unavailable after confirming availability” among the outcomes that are not refundable, so a transfer your floor misses after you confirm availability can still cost you. Pre-vetted transfers are priced by the tier the screener estimates (the carrier makes every underwriting decision), so a month of them falls between the two pre-vetted columns. Interest-verified transfers launch at $3,000, a minimum, not a contract. The pricing page lists the published transfer price and launch minimum beside every other product, and pre-vetted transfers at their published tier prices have their own page.
What that spend returns depends on your close rate on billable transfers, which only your floor can measure. Put your own rates into the lead cost calculator to see cost per sale on transfer spend.
What else caps daily volume: coverage hours, time zones and the states your agents are licensed in?
Three things outside the formula cap what a floor takes in a day: how many hours the volume is squeezed into, how time zones stack it, and which states it comes from.
Coverage hours
The same daily volume needs more agents in fewer hours. Ten agents offered 80 transfers across 8 coverage hours (10 an hour) lose 1.8%. Packed into 5 hours (16 an hour), the same 80 lose 12.2%, and the floor takes about 70 a day instead of about 79.
Time zones stack arrivals
Vendors set delivery windows on one clock or on the prospect's. Falcon FEX runs one clock: “Leads available from 10:00 AM to 8:00 PM EST with a short break at 2:30.” Lead Heroes lets agents choose “two 4-hour time blocks … either 10am-2pm or 2pm-6pm in the selected lead geography”, and Tele Leads Agency advises buyers to have the vendor deliver “Pacific-zone calls between 9 a.m. and 6 p.m. Pacific” (vendor claims, seen October 22, 2026). A window set in local time moves across your clock zone by zone. NIST's table of U.S. time zones puts Eastern, Central, Mountain and Pacific standard time 5, 6, 7 and 8 hours behind Coordinated Universal Time, one hour apart.
Example inputs: each zone sends 20 transfers a day in the same 10 a.m.–2 p.m. local block, to 10 agents on an Eastern-time floor with a 30-minute handle time.
| Hour (Eastern time) | Zones sending | Transfers offered that hour | Share lost |
|---|---|---|---|
| 10–11 a.m. | Eastern | 5 | under 0.1% |
| 11 a.m.–noon | Eastern, Central | 10 | 1.8% |
| noon–1 p.m. | Eastern, Central, Mountain | 15 | 10.0% |
| 1–2 p.m. | Eastern, Central, Mountain, Pacific | 20 | 21.5% |
| 2–3 p.m. | Central, Mountain, Pacific | 15 | 10.0% |
| 3–4 p.m. | Mountain, Pacific | 10 | 1.8% |
| 4–5 p.m. | Pacific | 5 | under 0.1% |
The day's 80 transfers lose about 7.6 (9.6%), against 3.5% if the same 80 arrived evenly across those 7 hours, and keeping the 1 p.m. hour to a 5% loss target would take 15 agents. Iversen's advice on dimensioning applies: “it is an advantage to have a predetermined well–defined busy hour.” Size to that hour, or ask the vendor to stagger the zones.
Licensed states and calling windows
Order only the states where your agents hold a license; each state you add brings its arrivals, and often another time zone, onto the same seats. Which hours a screener may call a prospect depends on the call and the prospect's state, so check the calling windows in each prospect's state before you set coverage hours. Floors that also dial out between transfers should size those dialing seats separately, with an outbound call center staffing calculator, and face a separate federal limit on abandoned telemarketing calls under 47 CFR 64.1200(a)(7).
How do you measure handle time, arrivals and lost transfers on your own floor?
Log every transfer with the seven fields below. Four of them, when it was offered, whether it connected, who took it and when that agent was ready for the next one, turn the tables into a model of your own floor.
What to log for every transfer
| Field | What it tells you |
|---|---|
| Time offered (your line rang) | Arrivals by hour, and your busiest hour |
| Time connected, or missed | Transfers taken against transfers lost to your floor |
| Agent who took it | The load on each agent |
| Time the agent was ready for the next transfer | Handle time, after-call work included |
| Prospect's state and time zone | How zones stack in your busiest hour |
| Billable under the five rules (yes or no) | Reconciles the invoice against your log |
| The vendor's outcome for a missed transfer | Re-routed, called back or billed, which is what a lost transfer costs you |
Check the model against your floor
- Log every offered transfer for several weeks, missed ones included. Use the vendor's delivery report only as a cross-check.
- Find the busiest hour. Iversen defines the time-consistent busy hour as the 60 minutes “which during a long period on the average has the highest traffic”, so average across days rather than picking one peak.
- Average your handle time from connect to ready, after-call work included. Only the average enters the formula.
- Compute the offered load, busiest-hour transfers times handle time in hours. Read the agents you need from the first table at that load, or enter the rate and handle time in the calculator above.
- Compare your measured share lost with the table. Far lower suggests the vendor paces delivery (arrivals are no longer random) or keeps a transfer waiting until an agent is free (no longer a pure loss system), so plan to the vendor's cap instead. Higher suggests agents who are logged in but not free, or bunched delivery, so add agents or narrow the order.
Idle time is the price of taking transfers live. At a 5% loss target, 10 agents are busy 58.9% of the time. Floors that fill the gaps with other calls should count that work in handle time, or take the agent doing it out of the transfer count, because an agent on another call is not free when a transfer lands. The lead types that keep seats working between transfers are compared on their own page.
Which states have the most residents 65 and older per insurance sales agent?
Hawaii and West Virginia have the most residents 65 and older per insurance sales agent job, 291 and 271, against 128 across the 50 states. Hawaii's job count is among the least precise in the table (a 12.1% relative standard error), so read the method note before comparing states.
| State | Residents 65 and older (ACS 2024) | Insurance sales agent jobs (OEWS May 2025) | Residents 65 and older per agent job |
|---|---|---|---|
| Hawaii | 311,305 | 1,070 | 291 |
| West Virginia | 386,851 | 1,430 | 271 |
| Alaska | 109,415 | 540 | 203 |
| Vermont | 148,485 | 730 | 203 |
| New Mexico | 429,233 | 2,200 | 195 |
| Maryland | 1,099,752 | 5,700 | 193 |
| Delaware | 227,824 | 1,220 | 187 |
| New York | 3,757,173 | 22,420 | 168 |
| Tennessee | 1,273,979 | 7,610 | 167 |
| Mississippi | 531,347 | 3,210 | 166 |
| Virginia | 1,550,385 | 9,480 | 164 |
| Michigan | 1,987,859 | 12,160 | 163 |
| California | 6,524,861 | 41,160 | 159 |
| Oregon | 850,217 | 5,370 | 158 |
| New Jersey | 1,706,665 | 11,370 | 150 |
| Wisconsin | 1,171,042 | 7,860 | 149 |
| Maine | 329,926 | 2,240 | 147 |
| Ohio | 2,271,397 | 16,250 | 140 |
| Illinois | 2,274,582 | 16,360 | 139 |
| Wyoming | 117,373 | 850 | 138 |
| Nevada | 575,351 | 4,200 | 137 |
| Pennsylvania | 2,665,974 | 19,390 | 137 |
| Connecticut | 713,337 | 5,230 | 136 |
| Massachusetts | 1,335,942 | 9,940 | 134 |
| Kentucky | 825,850 | 6,210 | 133 |
| South Carolina | 1,082,724 | 8,220 | 132 |
| New Hampshire | 303,232 | 2,320 | 131 |
| Washington | 1,378,508 | 10,500 | 131 |
| Oklahoma | 692,081 | 5,310 | 130 |
| Rhode Island | 220,168 | 1,700 | 130 |
| Alabama | 955,166 | 7,430 | 129 |
| Arizona | 1,491,158 | 11,870 | 126 |
| Arkansas | 562,707 | 4,580 | 123 |
| Indiana | 1,218,401 | 10,440 | 117 |
| Missouri | 1,169,201 | 10,030 | 117 |
| Montana | 241,423 | 2,090 | 116 |
| Louisiana | 819,864 | 7,100 | 115 |
| Idaho | 355,551 | 3,200 | 111 |
| Florida | 5,094,353 | 47,560 | 107 |
| Minnesota | 1,056,273 | 10,010 | 106 |
| Colorado | 980,364 | 9,530 | 103 |
| Georgia | 1,765,603 | 18,030 | 98 |
| North Carolina | 1,980,690 | 20,540 | 96 |
| North Dakota | 140,295 | 1,460 | 96 |
| South Dakota | 175,902 | 1,870 | 94 |
| Utah | 434,922 | 4,620 | 94 |
| Texas | 4,365,469 | 47,060 | 93 |
| Iowa | 612,603 | 6,840 | 90 |
| Kansas | 533,774 | 6,360 | 84 |
| Nebraska | 348,052 | 6,160 | 57 |
| All 50 states (sum of rows) | 61,154,609 | 479,030 | 128 |
How the state table was built
- Residents 65 and older: the Census Bureau's American Community Survey 2024 1-year estimates, Table S0101, “65 years and over”. Each state's count carries a margin of error of at most 1.4% of the estimate.
- Insurance sales agent jobs: Occupational Employment and Wage Statistics (OEWS) for May 2025, employment in occupation 41-3021, Insurance Sales Agents, from the Bureau of Labor Statistics' May 2025 state estimates.
- Jobs the survey covers. OEWS produces “estimates of the number of jobs in certain occupations”, and the OEWS FAQ says “The survey does not cover the self-employed, owners and partners in unincorporated firms, household workers, or unpaid family workers.” The Occupational Outlook Handbook says insurance sales agents “held about 572,600 jobs in 2025” and lists self-employed workers as 12% of them, a share these counts leave out.
- Every line of insurance. The Handbook describes agents who sell one or more types of insurance, among them property and casualty, life and health, so these are not counts of final expense agents.
- The District of Columbia is left out because its OEWS estimate was not released.
- Sampling error. The job estimates for 7 states carry a relative standard error above 10%: Rhode Island (16.9%), Alaska (13.1%), Nevada (12.3%), Hawaii (12.1%), Delaware (11.8%), Wyoming (11.7%) and South Dakota (11.6%). Treat small gaps between neighbouring rows as noise.
The ratio counts residents 65 and older against the insurance sales agent jobs OEWS covers, so it leaves out self-employed agents. It says nothing about demand for final expense coverage, lead prices or competition for transfers, and it is no basis on its own for adding or removing a state.